Ten myths around GEO that hinder business promotion in AI search

Ten myths around geo that hinder business promotion in ai search

With the rapid development of generative neural networks on the web, numerous tips have emerged on how to increase a website’s visibility in ai search. The problem is that many recommendations are not yet confirmed or are based on myths that have gradually started to be perceived as proven facts.

In this article, experts from click.ru:

  • analyzed popular misconceptions about promotion in neural networks;
  • found out where they came from;
  • looked at what can actually influence a website’s visibility in generative search.

Myth 1: SEO and GEO are the same thing

What the myth is There is an opinion that geo (generative engine optimization) is simply a new name for traditional seo. Some believe that search engines have changed slightly, neural networks have been added to them, but the principles of promotion remain the same. One can do the same things as before, just call it by a new name.

Where it came from Geo and seo do indeed have a lot in common. Firstly, generative optimization grew out of search optimization. Secondly, the basic principles of optimization have not disappeared. High-quality content, technical soundness of pages, their accessibility to search engines, and a clear structure remain important. Generative neural networks often use the regular search index. For example, google forms ai overviews based on the same page quality assessment and search systems that work for traditional results. Hence the opinion arises that it is enough to occupy high positions in the search results, and visibility in ai will appear on its own.

What is actually true Seo can be called the foundation for geo, but their goals are different. Classic seo helps to improve a page’s position in search results. Geo increases the chances that a neural network will choose content from a specific website for its answer and mention the brand. At the same time, seo and geo should not be opposed to each other. Technical optimization, high-quality content, and normal indexing are an important base for promotion in generative search.

Myth 2: It is unknown how neural networks work. it is impossible to perform geo tasks

What the myth is One of the common misconceptions sounds like this: “neural networks are a black box, which means it is impossible to understand why they choose some sources and ignore others. Consequently, it is also impossible to optimize a website for ai.”

Where it came from Google, openai, anthropic, and other companies indeed do not disclose all the nuances of how their models work. They do not provide the formula by which gemini or chatgpt select certain sources for an answer. However, there is a nuance: people confuse two concepts: the principles of operation of ai search engines and the architecture of the model. Only developers know the exact parameter values in gemini, gpt-5, or claude. But this does not mean that the entire system works unpredictably.

What is actually true In recent years, researchers have actively studied the stages a user query goes through. And here is what was found. In most cases, a neural network works as follows:

  • finds relevant indexed pages;
  • evaluates the content based on its relevance to the query;
  • extracts useful information from the pages;
  • generates an answer based on the found information. This approach is called RAG (retrieval-augmented generation). To date, this is the industry standard for ai search. Geo is not an attempt to guess the logic of a neural network. It is working with the structure and quality of content, information disclosure, the digital reputation of the brand, and the authority of the source.

Myth 3: AI services work with all information that exists on the internet

What the myth is Neural networks confidently answer almost any question, so it might seem that they have access to all existing pages on the internet. Hence arises another misconception: if a material is published and open to search robots, it will sooner or later definitely appear in ai answers. In practice, everything is more complicated.

Where it came from The reason for the misconception is a misunderstanding of how llms (large language models) obtain information. Many ai services know how to use search, and from the outside it seems as if the neural network instantly scans everything on the internet. In reality, it works with a more limited set of data.

What is actually true Neural networks do not read everything on the internet with every query. They work with a pre-collected package of data that is updated every couple of months. During an online search, an llm does not refer to all existing websites, but to pages indexed by yandex and google. From the found materials, the neural network takes only fragments that are relevant and meet other criteria. There is another limitation: the context window. This is the maximum volume of information that a model can process at once. Even modern llms can only interact with a finite number of tokens, so they are physically incapable of analyzing millions of web pages simultaneously.

Myth 4: There are technical techniques that guarantee inclusion in ai answers

What the myth is As soon as geo became actively discussed, the market was flooded with numerous promises and tips:

  • “add llms.txt, and chatgpt will definitely read your website”;
  • “rewrite texts using a special template for neural networks”;
  • “insert prompts on the page”. All recommendations share the idea that there are some technical tricks that guarantee a website’s inclusion in ai answers.

Where it came from The myth appeared for several reasons:

  • Geo is a young direction. There are no established standards in the market yet and very few confirmed cases, so guesses and hypotheses often take the place of proven practices;
  • Simple promises are easier to sell. It is much easier to offer a client a secret setting to get into chatgpt than to explain that promotion in ai is complex, comprehensive work that takes time and affects not only the technical part of the website.

What is actually true There is no technology that will guarantee with 100% certainty that a website will appear in the answers of chatgpt, alice, ai overviews, gemini, and other ai services. Moreover, search systems do not recommend looking for such secrets. For example, the official google help states that there are no separate technical rules for pages to appear in ai overviews beyond the usual requirements for search optimization. This does not mean that geo does not work. The chances of a website appearing in ai answers can indeed be increased, but not with one trick, but through systematic work. It includes:

  • a strong seo base;
  • publication of unique and up-to-date content;
  • increasing brand trust and expertise;
  • creating a logical and clear structure of materials;
  • using structured data, faq, tables, and lists;
  • including direct and unambiguous formulations, facts, and figures;
  • expanding digital presence and gaining mentions in authoritative independent sources. Difficulties often begin with the first point: the seo base is often either weak or practically non-existent.

Myth 5: For geo, it is enough to write “correct” texts

What the myth is Some companies perceive geo exclusively as work with content. It is enough to write and format the text correctly, and neural networks will start adding the website to answers more often. At the same time, the technical part, brand reputation, and other factors remain unattended.

Where it came from The misconception has two main reasons:

  • For a long time, text in seo was one of the main ways to convey information about the page’s content to search engines. In addition, the first recommendations for geo were indeed mostly related to content;
  • Modern llms work in text format. They receive a query and generate a text response. Therefore, it is easy to assume that one can only influence the choice through text.

What is actually true High-quality text is important for geo, but it is not enough. Neural networks and search engines take into account not only the content of a specific page, but also the information field of the website and the brand. The following matter:

  • the technical state of the resource and its accessibility to robots;
  • structured data that helps ai and search systems better understand the essence of pages;
  • brand reputation and its mentions in authoritative sources;
  • infographics, images, videos, and other types of content.

Myth 6: Only top websites can get into ai answers

What the myth is The logic of the myth is simple: if a website is not in the top positions in google or yandex, the neural network will not see it. Allegedly, ai primarily uses materials from the top of the search results. At first glance, the assumption seems logical, but there is no direct dependence here.

Where it came from Generative search is indeed closely related to traditional search engines. For example, google ai overviews uses the google search infrastructure, and alice uses yandex search technologies. Hence the opinion arose that the neural network simply takes information from the first pages of the results and retells it to the user.

What is actually true High positions can increase the probability of getting into an ai answer, but being in the top is not necessary for this. There are several reasons:

  • Generative systems are not limited to the top ten results. They can refer to multiple pages, select suitable materials, and compare data from different sources;
  • The value of information is important for ai. Original research, proprietary statistics, an official document, or unique expert material may turn out to be more useful than a page from the top and get into the answer, even if it occupies a lower position. Studies already show that search results and ai answer sources do not always coincide. According to Ahrefs, only 38% of the pages that google cites in ai overviews are in the top 10 of the results. In another ahrefs study, the match of cited links in chatgpt and gemini with the top ten of google results is about 8%. More than 80% of the sources used do not rank at all for the corresponding queries. It turns out that good positions in search give an advantage, but they do not guarantee citation by themselves. Conversely, the absence of a website in the top 10 does not mean that the neural network cannot use it as a source.

Myth 7: llms.txt is necessary for geo

What the myth is If one reads materials about geo over the past year, it might seem that without llms.txt, a website is unlikely to get into ai answers. The file is often called “robots.txt for neural networks” and it is advised to add it immediately when optimizing for generative search. Because of this, many website owners feel that llms.txt is a mandatory part of any geo strategy.

Where it came from The idea appeared in the autumn of 2024, when web standards specialist jeremy howard proposed the llms.txt format. It was assumed that a website owner could place links to the most important pages and documentation in a separate text file to make it easier for language models to navigate the resource structure. The concept quickly became popular. Plugins appeared for cms that automatically create llms.txt, and some seo services added recommendations to check for the file. The popularity of the idea led to llms.txt being perceived as a mandatory industry standard.

What is actually true Google states directly that it does not use llms.txt for ai search functions and google search. The company notes that the file is not needed to appear in generative services. This does not mean that the idea is completely useless. In the future, individual ai services may indeed use llms.txt as an additional source of information about the website structure. But today, there is no confirmed influence on geo.

Myth 8: Structured data is a guarantee of success in geo

What the myth is There is an opinion that microdata, schema.org, xml sitemaps, product feeds, and other technical elements are necessary primarily so that gemini, chatgpt, and other ai services can better understand the website. Sometimes bolder statements are encountered: it is enough to implement structured data, and the chances of getting into neural network answers will noticeably increase.

Where it came from Generative models indeed find it easier to work with well-organized data. Structured content is easier for both search engines and ai to interpret. But many often confuse cause and effect. The schema.org standard was launched back in 2011 so that search engines could better understand the content of pages. The main goal was the same as it is now: to make the information on the website machine-readable. Over time, useful technical advice began to be perceived as a universal solution. In many geo checklists, microdata began to be called one of the main factors influencing a website’s inclusion in neural network answers.

What is actually true Data structuring is indeed an important part of a high-quality website. But it does not provide an automatic advantage in generative search. Google and yandex have long recommended using schema.org. With the advent of ai answers, the advice has not changed. The official google guide separately emphasizes that there are no new markup requirements for generative search.

Myth 9: Mass publication of articles can replace brand development

What the myth is With the growing interest in geo, some companies began to act according to a familiar scenario: mass publishing of press releases, reviews, and promotional articles on dozens of platforms. The calculation is that the more often a brand is mentioned on the internet, the higher the chances of appearing in the answers of chatgpt, gemini, and other ai services. The logic seems simple and clear: if a neural network searches for information on the network, it means you need to fill it with content about yourself as densely as possible.

Where it came from The approach came from the times when search algorithms were simpler. Mass content placement did indeed increase a website’s visibility in search.

What is actually true For generative systems, it is not the number of mentions that matters, but the authority and quality of the sources. This is confirmed by research. For example, according to Resonate labs in the geo white paper v5.0, about 84% of the links used by ai systems come from independent publications. Paid content is cited noticeably less often. In geo, it is important not just to increase the number of materials about the brand, but to achieve mentions in authoritative media, specialized publications, and professional communities.

Myth 10: Only an seo specialist can handle geo

What the myth is Work on brand visibility in neural networks is often completely handed over to the seo team, since geo is related to search promotion. Therefore, it is the seo specialist’s area of responsibility.

Where it came from This approach is quite understandable. An seo specialist is already responsible for technical website optimization, page structure, internal linking, working with content and links. That is, for many factors that are also important for geo.

What is actually true Ai answers are influenced not only by the content of the website. Brand reputation, reviews, mentions in authoritative sources, research, publications in the media, materials from conferences, and other signals outside of classic seo are important. Geo is the result of work in branding, product management, pr, content marketing, seo optimization, and other areas. Geo is not a set of secret tricks. Neither llms.txt, nor microdata, nor mass publications guarantee inclusion in neural network answers by themselves. The task is not to please the neural network, but to become a noticeable and reliable source of information for it.

New economy of utility offers in 2026: From install to LTV

When viewed through the lens of a media buyer, the traditional utility offer model appears straightforward: purchase an install, guide the user to a trial or initial payment, calculate the CPA, and compare it against the payout.

However, the subscription economy only truly begins at this stage.

In 2026, the final outcome is simultaneously influenced by trial duration, pricing tiers, initial renewals, subsequent charges, voluntary cancellations, failed payments, geographic regions, and even the specific storefront through which the user pays.

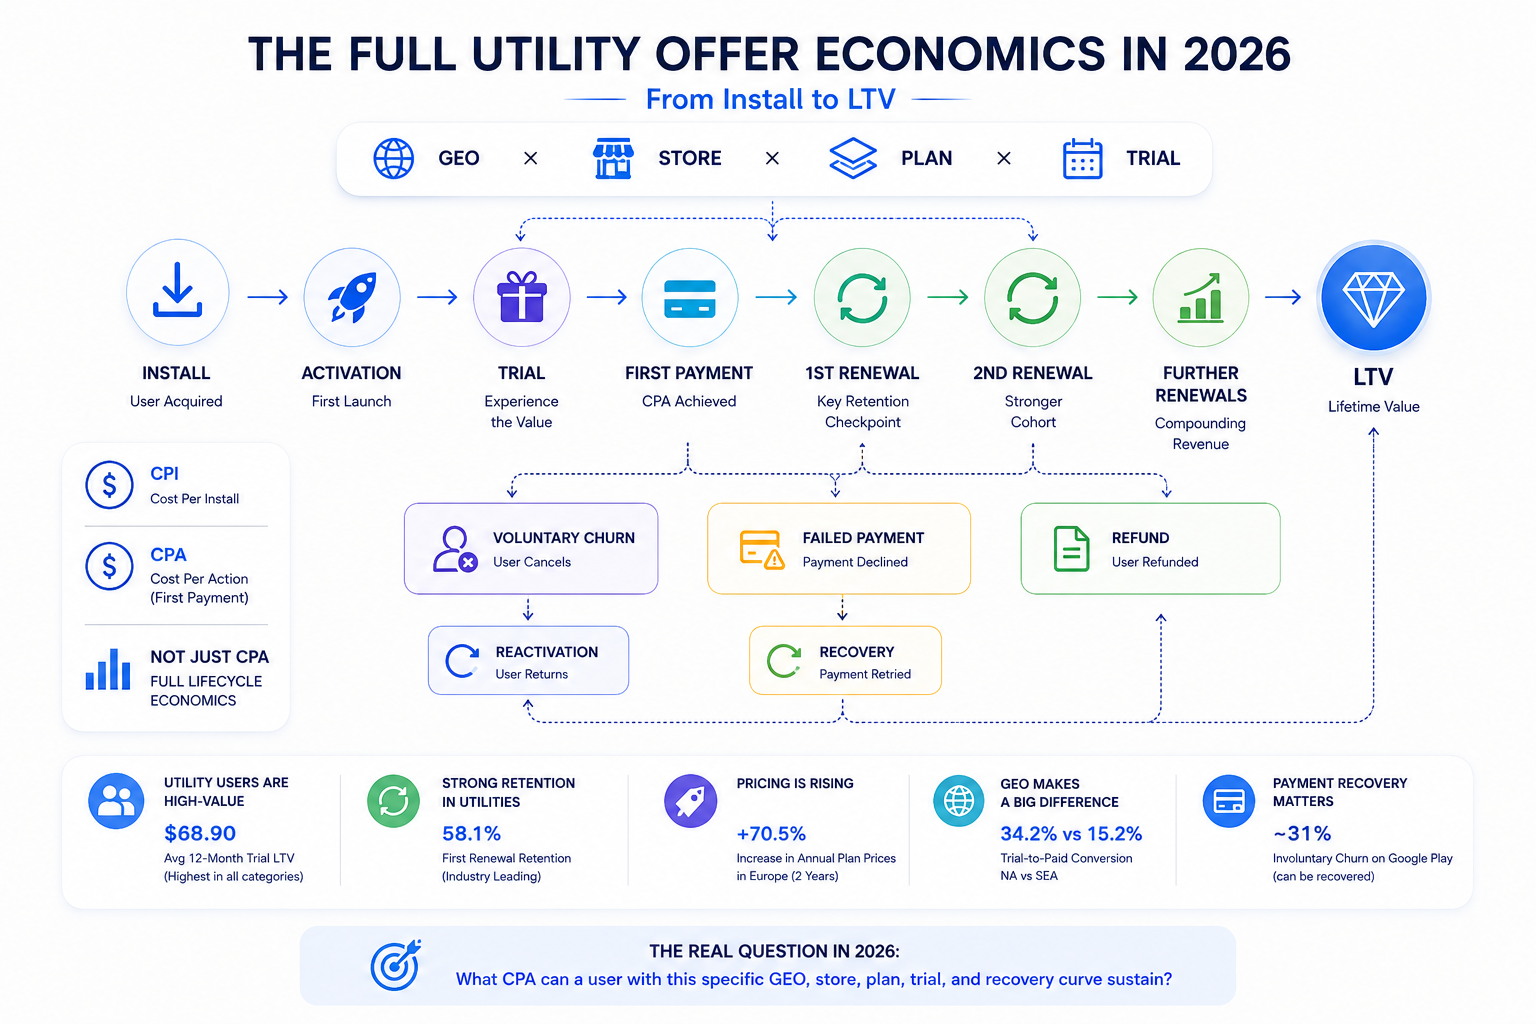
Concurrently, the payment infrastructure of Google Play is evolving. Starting June 30, 2026, Google began separating service and billing fees in the US, EEA, and the UK, while providing developers with more alternatives for external billing and payments. Consequently, the primary question regarding a utility offer is no longer “what is its CPA?”. Instead, it is: “what CPA can this offer genuinely sustain when evaluating the entire user lifecycle rather than just the initial purchase?”

Google play changes billing, but what exactly changes for offer economics?

Google has begun separating service and billing fees. Simultaneously, it is expanding payment options: developers can now utilize alternative billing methods or direct users to their own websites for purchases. With alternative or external billing, the additional fee is not applied. For utility offers, this is significant not because Google lowered its commission as an abstract fact, but because the mathematics of every subsequent transaction are changing.

In the current scenario, Google specifies a 10% service fee for the first $1 million in annual revenue, plus a separate 5% billing fee when using Google Play Billing. With alternative billing, the additional 5% fee is waived.

Consider a hypothetical $39.99 subscription. With a combined 15% fee, approximately $33.99 remains. With a 10% service fee and no additional billing charge, roughly $35.99 remains. On a single transaction, the difference is about $2. However, a subscription does not end there. If a user renews multiple times, this difference compounds on every transaction. Therefore, the shift in the billing model can affect not only net revenue but also the maximum CPA an offer can sustain.

One cannot simply conclude that because Google lowered its commission, the CPA can be mechanically increased by 5%. The final outcome depends on the number of renewals, the percentage of users who reach them, refund rates, and the specific pricing scheme. In other words, Google’s new rule makes modeling the entire subscription lifecycle far more important than calculating just the first transaction.

Why the store itself is already part of unit economics

Examining data from RevenueCat reveals that the disparity between the App Store and Google Play is even more pronounced. Globally, the Revenue Per Install (RPI) is $0.42 for the App Store compared to $0.16 for Google Playβ€”approximately 2.6 times higher. In North America, for instance, this gap widens further: $0.65 on iOS versus $0.26 on Android. This does not mean every iOS offer is automatically more profitable than every Android offer. However, it does mean that an identical CPI cannot be assumed to be equally effective across different platforms.

Imagine two campaigns with the same CPI. If one drives users to iOS in North America and the other to Android in the same region, the subsequent revenue per install will likely diverge significantly before retention is even factored in.

Therefore, in 2026, it is far more logical to evaluate a utility offer model at least across the matrix of: GEO Γ— store Γ— subscription plan. Only after this segmentation should CPA and LTV be compared.

What makes a utility user expensive

According to Adapty, a utility user who initiates a subscription via a trial generates an average revenue of $68.90 in their first 12 monthsβ€”the highest 12-month trial LTV among all categories in the study. The average LTV across all plans in this category is $46.30, while the 12-month Install LTV stands at $1.09. Furthermore, utilities lead in first-renewal retention at 58.1%.

The Install LTV metric is particularly intriguing here. CPA indicates how much was paid for a user who completed a specific action. Install LTV reveals how much revenue the acquired install generates on average over a set period. This creates a much more practical performance sequence: CPI β†’ Install LTV β†’ acquisition ROI. From there, Install LTV can be broken down further: install β†’ trial β†’ payment β†’ renewal β†’ subsequent payments. This clarifies why two offers with identical CPIs can have vastly different acceptable acquisition thresholds.

How this looks on a real utility offer

WPS Office by CIPIAI is a direct Android utility offer with CPI pricing, available across 242 GEOs. According to company data, in Vietnam, the offer achieved a 0.4% conversion rate and a 30% ROI on pop-under traffic without a pre-lander, directing users straight to the advertiser’s landing page.

This serves as an excellent example that a web-to-app funnel does not necessarily require numerous intermediate steps. If the sequence of traffic source β†’ advertiser landing page β†’ install operates efficiently, adding a pre-lander does not inherently improve the funnel.

For a media buyer, the critical question is: which stage genuinely increases the probability of installation and subsequent monetization, and which merely adds friction between the click and the product? Thus, Install LTV becomes an invaluable companion to CPI, allowing evaluators to assess not just the cost of an install, but the average revenue that specific install generates.

Why weekly is sometimes more interesting than annual and why price cannot decide this

In the utility sector, weekly plans generate the majority of the category’s revenue. Conversely, annual plans demonstrate the strongest long-term retention: after one year, 22.1% of users on annual plans remain active, marking the best retention rate among all categories in the Adapty study.

In essence, weekly and annual plans solve different problems. A hypothetical $5.99 weekly plan might yield numerous consecutive transactions if the user continues to perceive value. A $39.99 annual plan delivers a larger sum upfront, but the user makes a different purchasing decision and follows a different renewal logic. Therefore, simply comparing $5.99 against $39.99 reveals nothing about true efficiency.

A more revealing metric is the total revenue each user generates over the entire lifespan of the subscription. Here, another crucial detail emerges: the price itself is changing.

Adapty data indicates that annual utility plan prices in Europe surged by 70.5% over two yearsβ€”the largest increase among all category and region combinations in the study. The global median subscription price in 2026 is $7.48 for weekly, $12.99 for monthly, and $38.42 for annual plans.

Consequently, historical maximum CPA benchmarks cannot be mechanically carried forward. If the subscription price has increased, the user’s potential revenue has changed. However, user behavior may shift alongside it: a more expensive plan does not necessarily maintain the same renewal coefficient.

RevenueCat illustrates this clearly: on annual plans, the median first renewal rate is 37% for the low-price segment, compared to just 24% for the high-price segment. By the third renewal, this gap nearly vanishes. Thus, a higher price might yield more money from a single purchase, but it simultaneously increases early churn.

Price is not LTV. Price is merely one of its components.

How this works in the revshare model

The distinction between first-time conversion and long-term economics is especially visible here. MacKeeper by CIPIAI is a direct utility offer operating on a RevShare model, available in 243 GEOs. For this model, user value is not realized in a single initial transaction, but in subsequent payments that accumulate into the partner’s total income.

For a media buyer, this is a crucial practical consideration: RevShare cannot be evaluated using the same logic as CPI or CPA. If the payout depends on the user’s ongoing monetization, retention and accumulated LTV become intrinsic parts of the payout itself.

Therefore, when comparing a RevShare offer to a fixed CPI/CPA offer, it is vital to look beyond the first conversion and assess how much the user is capable of generating over the entire subscription lifecycle.

Why the market shortens trials, although data says the opposite

The situation with trials is even more fascinating. According to Adapty, the proportion of utilities utilizing trials grew from 78.0% to 84.7% over a single year. This indicates it is no longer an optional mechanic for a subset of apps, but rather a standard monetization component for the category. Simultaneously, the market is broadly shifting toward shorter trial periods. RevenueCat notes an increase in trials lasting up to four days, rising from 42.1% to 46.5%. Meanwhile, the share of 17–32 day trials slightly decreased to 5%.

This creates a paradox. Short trials are becoming more popular, even though longer trials convert better on average. For trials lasting up to four days, the median trial-to-paid conversion is 25.5%. For 5–9 days, it is 37.4%. For 17–32 days, it reaches 42.5%. Thus, a longer trial period converts approximately 17 percentage points better than the shortest option and roughly 1.7 times better in median conversion.

Why, then, does the market continue to shorten trial durations? Because early conversion is not the sole objective. A short trial yields results faster, shortens the experimentation cycle, and allows teams to determine if a bundle works much sooner.

However, this speed comes at a cost. For three-day trials, 55.4% of cancellations occur on day zero. For seven-day trials, this figure is 39.8%; for 14-day trials, 35.7%; and for 30-day trials, 31.1%. Notably, 84% of cancellations for three-day trials happen within the first 24 hours. Therefore, concluding that a three-day trial “converts better” is overly simplistic.

The correct question is: does it genuinely guide the user to the goal faster, or does it merely rush them to the cancellation point?

Furthermore, trials can impact partner risk differently. For instance, FlickVPN iOS by CIPIAI operates on a CPT model across 26 GEOs. This offer utilizes a trial model on iOS and, according to CIPIAI, performs exceptionally well with push traffic in the US, CA, and AU. The key distinction here is that the partner receives a payout simply for the trial being initiated, not for a subsequent renewal.

This demonstrates why an identical user journey can possess entirely different economics for a partner. In a classic subscription model, the media buyer assumes the risk that the user will not renew after the trial. With CPT, the billable event is the trial start itself. Consequently, comparing such an offer to a RevShare model cannot be done based on a single CPA. They have different points of result fixation and, consequently, different risk profiles.

Why geography matters, not just trial length

Another reason to avoid using a single benchmark for all campaigns is geography.

RevenueCat data shows that the median trial-to-paid conversion in North America is 34.2%, whereas in Western Europe, it is 29.7%. For comparison, in India and Southeast Asia, this metric drops to 15.2%.

The gap between North America and Western Europe is nearly 5 percentage points at the trial-to-paid stage alone, and these discrepancies compound further down the lifecycle.

For weekly subscriptions, the first renewal rate is:

  • 55% in North America;
  • 42% in Western Europe.

For monthly subscriptions:

  • 55% in North America;
  • 55% in Western Europe.

For annual subscriptions:

  • 26% in North America;
  • 28% in Western Europe.

Thus, GEO influences not only acquisition costs. It can fundamentally alter the shape of the LTV curve. Therefore, extrapolating campaign results from the US to Western Europe simply because both are Tier-1 regions is an unreliable modeling strategy.

Where LTV actually begins: The first renewal

Now, for the most critical segment. Assume a user has already purchased a subscription. For a basic report, a checkmark can be placedβ€”CPA is achieved. For the business, it is still too early. Adapty indicates that utilities boast a 58.1% first-renewal retention rate, a defining metric for the category. RevenueCat simultaneously illustrates the overall renewal curve based on subscription length.

For weekly plans, the first renewal sits in the 35-54% range, while the second jumps to 68-81%. For monthly plans, the first renewal is approximately 53-61%, and the second reaches 65-77%. For annual plans, the first renewal is significantly lower, around 23-40%, but the metric subsequently climbs to 44-64% on the second renewal and 56-70% on the third.

The primary takeaway here is not the specific percentage. The first renewal is the critical bottleneck of the funnel. After this point, the users who remain form a noticeably more stable cohort. RevenueCat records a surge of 18-27 percentage points between the first and second renewals, depending on the subscription length. Therefore, for a media buyer, the first purchase and the first renewal represent two entirely different tiers of traffic quality.

Conceptually, CPA1 represents the cost to secure the first payout, while CPA2 represents the ad spend allocated per user who reaches the second billing cycle. The latter metric aligns far more closely with the true economics of a subscription.

What happens after the first payment

The complete lifecycle of a utility user unfolds as follows: click β†’ install β†’ first launch β†’ onboarding β†’ paywall β†’ trial β†’ first payment β†’ first renewal β†’ further renewals β†’ voluntary churn β†’ failed payment β†’ recovery β†’ refund β†’ final LTV. Each stage answers a distinct operational question.

Install β†’ first launch The user has been acquired by the ad but has not yet paid. The alignment between the advertising promise and the actual product is paramount here. If the ad promises a specific utility function, but the user encounters a different scenario post-install, the problem manifests before the paywall is even reached.

First launch β†’ paywall β†’ trial This stage determines whether the application can demonstrate its value quickly enough. RevenueCat indicates that the vast majority of trials begin immediately, making the first session absolutely critical.

Trial β†’ first payment Here, the familiar CPA metric emerges. However, it still reveals nothing about the long-term quality of the user.

First payment β†’ first renewal This is where the commercial offer faces its true test. If the user does not perceive sufficient value by the next billing date, the initial purchase fails to evolve into sustainable LTV.

Why the second payment is sometimes more important than the first purchase

Consider two hypothetical offers. Offer A: 1000 installs β†’ 100 trials β†’ 30 first payments. Offer B: 1000 installs β†’ 100 trials β†’ 25 first payments. Initially, Offer A appears superior. However, introduce the first renewal metric. If a smaller proportion of Offer A’s users reach the second payment, while a larger proportion of Offer B’s users do, Offer A’s early advantage may completely vanish.

This is precisely why reporting should track not just: CPI β†’ trial β†’ first payment, but rather: CPI β†’ trial β†’ first payment β†’ first renewal β†’ second renewal β†’ Y1 LTV. Furthermore, this must be segmented by GEO, store, and subscription type. This introduces a fundamentally different acquisition evaluation logic: not “what CPA does the offer provide,” but “what CPA can a user with this specific recovery curve sustain.”

This is clearly illustrated when comparing three real utility offers from CIPIAI with different payment models: WPS Office, FlickVPN, and MacKeeper.

  • WPS Office is a direct Android utility offer with CPI pricing, available in 242 GEOs. Here, the partner’s point of result fixation is the install.
  • FlickVPN is an iOS offer with CPT pricing in 26 GEOs. Here, the partner is paid for the initiated trial, not the subsequent renewal. The fixation point is further down the funnel: the user must not only install but also start the trial.
  • MacKeeper operates on RevShare across 243 GEOs. Here, the partner’s economics are even more heavily dependent on the user’s ongoing monetization; value is not capped at an install or trial start, but unfolds through subsequent payments.

This yields three distinct models of the same utility funnel:

  • WPS Office: install β†’ CPI payout;
  • FlickVPN: install β†’ trial β†’ CPT payout;
  • MacKeeper: install β†’ further monetization β†’ RevShare payout.

Consequently, comparing these offers solely on first conversion is inaccurate. They possess different result fixation points and distinct risk profiles for the partner. In CPI, the result is the install; in CPT, it is the started trial; in RevShare, the partner relies on continued user monetization.

While existing data is insufficient to definitively calculate which of the three offers will yield higher LTV or profitβ€”such a comparison requires actual payout sizes and downstream funnel metricsβ€”the payment model itself reveals the core truth: an identical user journey up to the install does not guarantee identical offer economics thereafter.

There is another type of loss: The user did not want to leave

Not every user who stops paying voluntarily canceled their subscription.

RevenueCat estimates that approximately 31% of cancellations on Google Play are linked to involuntary churn, meaning payment failures (compared to roughly 14% on the App Store). These are fundamentally different scenarios. In the first, the user states: “I no longer need this product.” In the second, the user implies: “I am still subscribed, but the payment failed.” In the latter scenario, a portion of these users can be recovered.

Google Play utilizes a grace period and account hold to restore subscriptions. Since December 2025, the standard account hold duration for new and eligible existing plans is calculated automatically: the initial formula is 60 days minus the grace period length. Google explicitly links this change to providing more time to resolve payment issues and reducing involuntary customer churn.

At the lifecycle level, Google separately tracks subscription transitions between active, grace period, account hold, canceled, and expired states. For the current subscription status, Google recommends using Subscription Purchase V2 as the source of truth.

Apple employs a similar principle: the grace period allows users to retain access to paid content while Apple continues attempting to process the payment. Subscription grace periods are available in 3, 16, or 28-day increments, though for weekly plans, the actual period is capped at six days if longer settings are selected.

Consequently, a failed payment is not always churn. It is a distinct funnel segment that warrants separate measurement: failed payment β†’ recovery β†’ recovered revenue.

Why billing recovery must also enter the economic model

Imagine two identical offers. Both possess:

  • Identical CPI;
  • Identical trial conversion;
  • Identical first-purchase CPA;
  • Identical first renewal rates.

However, for one product, a significant portion of failed payments is successfully recovered, while for the other, users permanently abandon the service after a payment error. At the CPA level, they appear identical. At the LTV level, they are not. Therefore, the realistic model no longer looks like: CPI β†’ trial β†’ CPA β†’ profit, but rather: CPI β†’ install β†’ activation β†’ paywall β†’ trial β†’ first payment β†’ first renewal β†’ further renewals β†’ voluntary churn β†’ failed payment β†’ recovery β†’ refund β†’ LTV. It is precisely this final segment that can explain the divergence between two offers that appear identical in their early stages.

Another nuance: Not all users after churn are lost forever

RevenueCat separately highlights that a portion of churned subscribers eventually return.

For monthly plans, the median reactivation rate is approximately 20%, for weekly plans it is around 9%, and for annual plans, it is about 5% within a year. The variance between categories is substantial. This serves as another reason not to view churn as an absolutely terminal event.

For weekly and monthly plans, there is considerable room for win-back campaigns. For annual plans, reactivation is significantly weaker, meaning a canceled user is far more likely to be permanently lost on a one-year horizon. In an LTV model, this implies that churn should also be segmented: voluntary churn β†’ reactivation, and involuntary churn β†’ payment recovery. These represent distinct user return mechanics and separate sources of incremental revenue.

Conclusion: The main formula of a utility offer

If all of this is distilled into a single concept, it is quite straightforward.

The flawed model: CPI β†’ trial β†’ CPA β†’ profit.

The functional model: CPI β†’ install β†’ activation β†’ trial β†’ first payment β†’ first renewal β†’ further renewals β†’ voluntary churn β†’ failed payment β†’ recovery β†’ refund β†’ LTV.

Layered on top of this chain is the matrix of: GEO Γ— store Γ— subscription plan Γ— trial period.

Only then does it become clear why two offers with identical CPIs can possess entirely different economics. One rapidly drives the user to a first purchase but loses them at the first renewal. Another has slightly higher acquisition costs and lower early conversion, but its users remain loyal much longer. A third maintains excellent retention but loses a portion of revenue to failed payments. A fourth might underperform against a global benchmark but excel spectacularly within a specific Tier-1 GEO and on a specific storefront.

Therefore, the media buyer’s question in 2026 is gradually shifting. It is no longer: “What is the offer’s CPA?”

Instead, it is: “What CPA can a user with this specific GEO, store, plan, trial, and recovery curve sustain?”

It is precisely at this intersection that CPI and CPA cease to be the final evaluation of an offer and become what they truly are: mere data points within the complete economics of the user lifecycle.

How to monetize gaming traffic through digital goods: an analysis of game, subscription, and software purchases

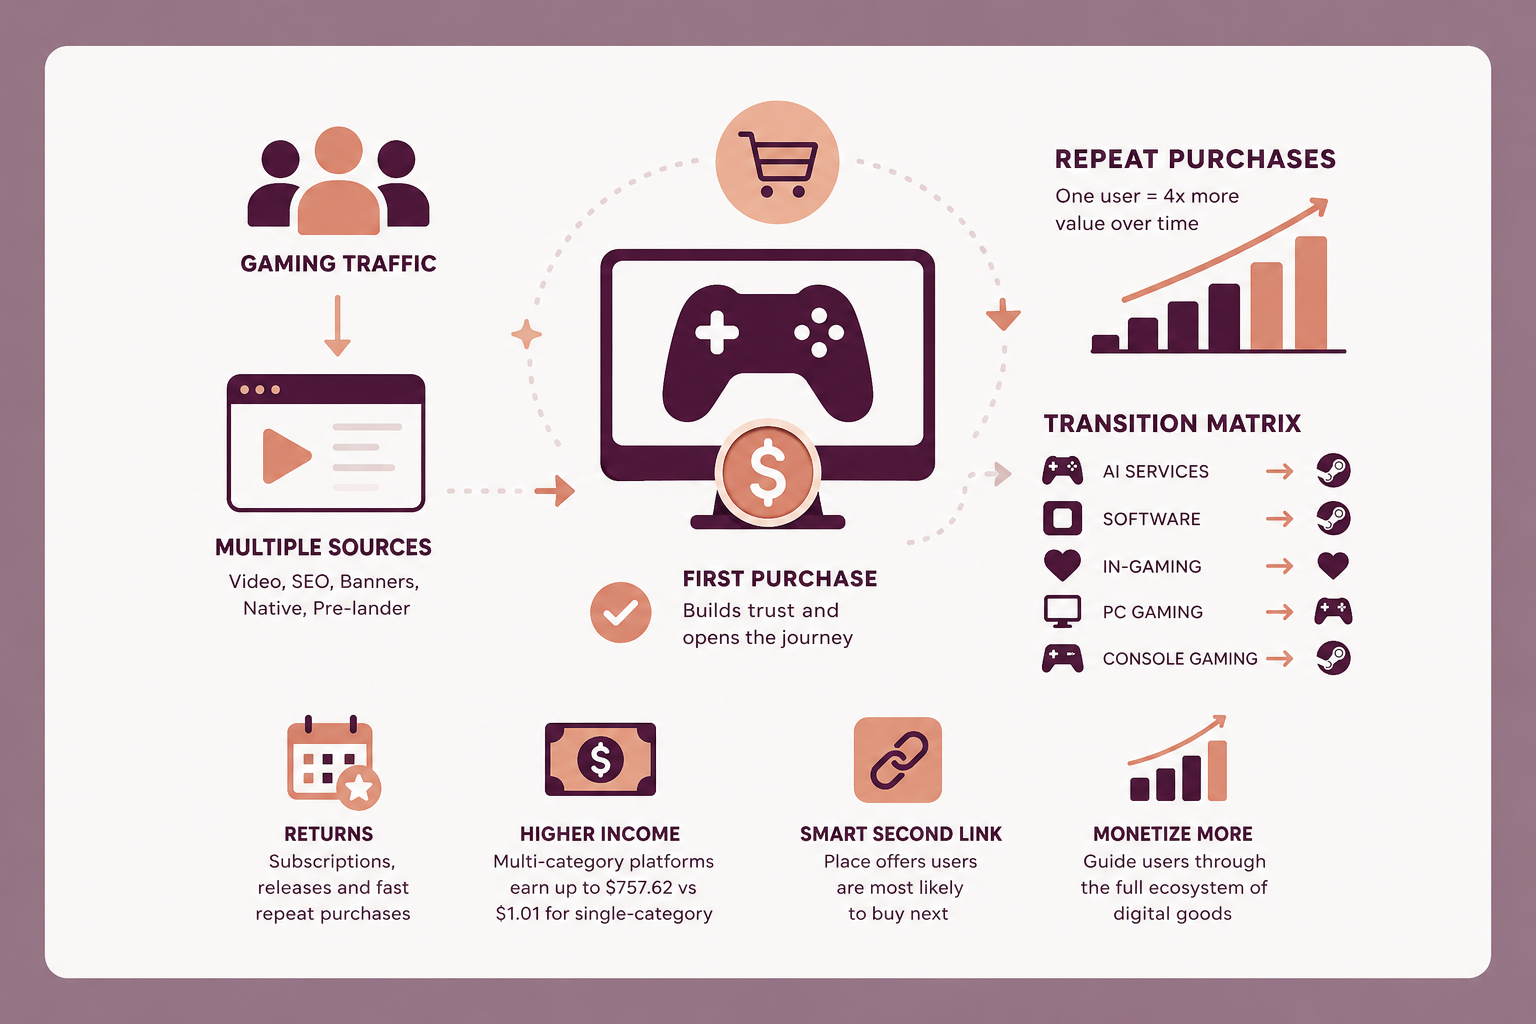
Typically, a webmaster earns a commission from every purchase a user makes, not just the initial one. A person might buy a game key, top up their Steam wallet a week later, and pay for an artificial intelligence subscription a month after that. If the user clicked the same referral link for all three transactions, the webmaster receives a commission from all three purchases.

When repeat purchases are factored in, a single user is worth approximately four times more than they appear to be based solely on their first sale.

At gglead, analysts calculated where a gaming user goes after their initial purchase. The following sections explore how to work with this data effectively, what to place as a secondary link, and where a mono-product platform inadvertently hands revenue over to competitors.

Why the term “gaming traffic” is outdated

The term usually implies a simplistic solution: if the audience is interested in gaming, one should only sell them gaming-related items. This category traditionally includes game keys, Steam top-ups, and in-game donations.

“Gaming audiences purchase not only gaming goods. There is a noticeable overlap with messengers, social networks, subscriptions, AI services, and software. This allows gaming webmasters to expand their content and offers into adjacent digital categories.”

The same trend is evident in the Deloitte Digital Media Trends 2026 study. Researchers surveyed 3,575 individuals, focusing not just on gamers, but on “fans”β€”those who identify with at least one fandom. Such individuals make up approximately 80% of the population.

Among fan-gamers, 75% are active gamers, while among other fans, the figure is 52%. Fans purchase paid gaming subscriptions more than three times as often: 39% compared to 11%. For music subscriptions, the gap is 67% versus 40%.

The same individual pays for games and virtually all other digital services.

Consequently, the label “gaming traffic” limits not the audience itself, but the available assortment. To rectify this, a webmaster does not need to change their traffic channel or seek new subscribers; they simply need to add another link pointing to a product that might genuinely interest the user.

Where the journey begins with a purchase

What a person buys first depends less on their personal identity and more on where the referral link is placed.

Platforms like Twitch and YouTube drive buyers more frequently than other sources, as they possess their own distinct target audiences. However, once a webmaster focuses heavily on a specific product, the performance difference between traffic sources nearly disappears. There is no single, universal entry category for gaming traffic.

Age demographics also diverge significantly:

“The younger demographic arrives from video content, while the older demographic comes from text-based placements.”

Younger users engage with video content, whereas older users are drawn to SEO and text placements. Consequently, the content packaging must differ. In video formats, the offer capitalizes on impulse, whereas in text formats, payment methods must be detailed comprehensively.

The schemes by which gglead webmasters attract users include:

  1. Pre-lander: An SEO site drives contextual traffic to its own curated top lists or showcase, from which the user proceeds to the platform.
  2. External resources: Indexing in search results (with assistance from gglead), followed by content containing an embedded link.
  3. Banner: Directs the user straight to the merchant site.
  4. Native: Utilized only for fixed placements and via video. The user seeks a specific product or searches for a deal.

Ultimately, the first purchase dictates everything. It acts as a trust testβ€”determining whether it is safe to make payments on the platform or not.

“In every product category, first purchases are distinct. If the first purchase goes smoothly, the second one definitely will.”

What they buy next: the transition matrix

To place a secondary link effectively, one must know what the user is likely to buy next. At gglead, analysts calculated who remains within their original category and who migrates to adjacent ones.

  • AI services: About 40% stay within their category. The rest migrate to Steam, Apple gift cards, and other AI services.
  • Software: The primary direction is Steam top-ups, accounting for up to 20%. Afterward, the user often returns to software and explores adjacent areas, such as Microsoft 365.
  • In-gaming: 50-60% remain within their category and adjacent donation categories. A small fraction moves to Steam and Telegram.
  • PC gaming: Almost 80% either stay within top-ups or proceed to choose new games. There is movement, but it remains entirely within the category.
  • Console gaming: Up to 80% stay within the console ecosystem. Up to 5% venture out to Steam top-ups.

There are no dead-end categories; an exit to an adjacent category exists from every starting point. It is crucial to consider the nuances of each transition.

What can be placed as a second touchpoint:

Entry category Second touchpoint Why this works
AI services Steam top-up, Apple cards, adjacent AI services Only 40% stay in their category; the rest naturally migrate to adjacent ones.
Software Steam top-up, followed by office subscriptions Up to 20% transition to Steam, making it the most massive direction.
In-gaming Donations in adjacent games, Steam top-up, Telegram 50-60% stick to their own and adjacent donation categories.
PC gaming Game selection, add-ons, pre-orders Almost 80% do not leave the category; it is too early to lead them out.
Console gaming Depth within consoles, Steam top-up Up to 80% remain inside; up to 5% venture out.

Categories are divided into two distinct types:

  • From consoles and PC gaming, almost no one leaves; about 80% stay inside. The second link here should remain within the same theme.
  • From AI services and software, more than half leave. Here, it makes sense to build a long conversion chain.

Steam top-up serves as a common entry point. Users transition to it from software, in-gaming, and consoles.

Important: The transition percentage and the revenue generated from it are different metrics. Up to 5% of console users might transition to Steam, which seems small. However, Steam is topped up regularly, meaning a link with a small transition percentage can ultimately generate more revenue than one with a large percentage.

Which users return more often

Major releases, cult classic games, and everything that operates on a subscription basis (AI services and software) yield the best return rates. However, their return mechanisms function differently.

  • Subscriptions return by calendar: In a month, the subscription needs renewal. The date is known in advance, allowing a promotional post to be scheduled accordingly.
  • A release returns by news hook: A new game launches, and users arrive specifically for the key.
  • Other categories return quickly but unpredictably: A person might return in two days, but for an entirely different product.

What this means for content strategy: subscriptions provide steady income between major releases, and a single monthly reminder is sufficient for them. A release creates a revenue peak, but between these peaks, the platform needs a baseline income, and it is best to establish that foundation in advance.

Where webmasters lose money

The average income of a webmaster promoting two or more categories can reach $757.62, compared to a mere $1.01 for a webmaster restricted to a single category.

“Platforms working with multiple categories are significantly more effective than those limited to a single category.”

The mechanics of these losses are clear:

  1. One product for the entire platform: A user returns a week later needing something else, but the platform does not offer it. The user searches independently and clicks a competitor’s link.
  2. Content does not adapt to retail: The same presentation is pushed across all placements. In contrast, for major partners, gglead assembles separate showcases and closed hubs tailored specifically to the channel’s theme.
  3. Income is counted per post: This method only reveals the first purchase. The remaining three-quarters of the user’s lifecycle do not appear in the report, making the second category seem like unnecessary extra work.

How much of the fourfold growth comes from adjacent categories versus repeat purchases within the same category is not visible from general industry figures. This can only be calculated by analyzing one’s own specific audience.

How to restructure content

The conversion chain is assembled from the transition matrix, and for the two types of categories, the strategy differs.

For consoles and PC gaming, the chain is short and remains entirely within the theme: top-up, game selection, add-ons. Attempting to direct such an audience to AI services on the very first touchpoint is futile; 80% will not convert.

For AI services and software, the chain is long. From these starting points, a user naturally moves to adjacent sections; the only variable is whose referral link they will use.

Three formats for the second link

Steam is the most frequent second step from almost any category. It can be integrated into content in the following ways:

  • Release-specific compilation: A post about an upcoming game where the purchase and top-up method is embedded in the text as part of the instruction, rather than presented as a blatant offer.
  • Top-up guide: This addresses the primary objection when buying digital goods. At gglead, analysts note that exactly this type of content converts best: content that details payment method choices and explains how the transaction is secured.
  • Showcase or pinned post: A permanent destination where a user returns voluntarily, and where subscriptions and software are displayed alongside games.

“Here, all content formats can convert; the main thing is to know what to lead the user to and with what unique selling proposition.”

Why the conversion chain ultimately decides the outcome: according to Deloitte, 52% of fans learn about new content primarily from social media, and among Generation Z, this figure rises to 73%. At the same time, 44% discover content on social media but complete the purchase elsewhere. The webmaster is present where the person learns about the product, but the person pays wherever a convenient link happens to be at hand.

What to ask from the affiliate network

The conversion chain is best built around one’s own audience, and this is exactly what can be requested from the affiliate network.

  • Analysis of own purchases: At gglead, analysts examine what the specific partner’s audience has purchased and provide recommendations on unique selling propositions.
  • Closed hub or separate showcase: Tailored for the channel’s specific theme. These are assembled for partners who already generate a large volume of traffic.
  • Adaptation of creatives and bundles: Customized for a specific platform.
  • Custdev data and budget insights: Information on where the affiliate network is directing its largest marketing budgets.

“We provide all requested materials, and we also create retail setups and closed hubs individually for the partner and the channel’s theme.”

Conclusion

A platform that counts income strictly per post is only capturing a quarter of its potential revenue. The rest is claimed by whoever the user turns to for their second and third products.

The broader market is moving in the same direction. According to Newzoo, in 2025, the gaming market exceeded $200 billion for the first time. Simultaneously, acquiring a new user is becoming more expensive, prompting developers to focus increasingly on monetizing the audience they already possess. The platform operates on the same logic: it is far cheaper to extract additional value from someone who has already made a purchase than to acquire a completely new customer.

At gglead, growth is expected across all digital goods categories, and within those categories, the products that receive focused marketing attention will see the most significant spikes. Partners are given hints about where large budgets are flowing to prevent overlap in advertising campaigns.

A gaming offer is most often not the final sale. It is merely the user’s first contact with the entire ecosystem of digital goods. From that point forward, everything depends on whether the platform has a logical next step to guide them toward.

Research of main internet advertising metrics: Analyzing the 2nd quarters of 2025 and 2026

Before launching an advertising campaign, marketing professionals must grasp the current market landscape. Understanding the cost of audience acquisition, identifying the most effective platforms, and determining the necessary budget to achieve business goals are fundamental steps. Without this data, evaluating campaign profitability and wisely allocating expenses based on a specific niche, region, and chosen promotional channels becomes incredibly difficult.

To simplify this process, a quarterly comparison of 2025 and 2026 metrics was conducted using the “pulse of click.ru” tool. The analysis examined how key internet advertising indicators have shifted and explained the underlying reasons for these changes. This article explores:

  • Which advertising channel saw a decrease in cost per thousand impressions;
  • Where the cost per click dropped;
  • Which platform emerged as the leader in click-through rates;
  • The factors that influenced these trends.

What is pulse of click.ru and what data does it display

Pulse of click.ru” is a free analytical service that aggregates advertising campaign statistics to help evaluate market conditions. It is built upon anonymized data from the ad campaigns of click.ru users, other promopult group projects, and partner services.

Using “pulse,” professionals can discover:

  • Average cpm, cpc, ctr, cpa, and cr values across various advertising platforms;
  • Metrics broken down by region and industry niche;
  • The average advertiser check size;
  • Statistics regarding counters, auto-strategies, and retargeting efforts.

Within “pulse of click.ru,” users can customize reports to fit specific objectives and obtain the required analytics in a convenient format. To unlock all the tool’s capabilities, simply registering an account with click.ru is required.

How this research benefits marketers and advertising specialists

A comparison of the metrics from the second quarter of 2025 and 2026 was performed to provide specialists with reliable benchmarks for budget planning in upcoming reporting cycles. The gathered data offers a clear view of how key indicators have evolved over the year, enabling more accurate future fund allocation.

This research helps marketing teams:

  • Save timeβ€” the relevant data has already been collected and analyzed;
  • Examine key metric insightsβ€” q2 cpm, cpc, and ctr were compared across different ad systems to highlight current trends;
  • Plan budgets more accuratelyβ€” assess placement costs and distribute advertising investments across channels based on the current market reality.

Cpm, ctr and cpc in the second quarters of 2025 and 2026

Below is a comparison of how cpm, cpc, and ctr shifted during the second quarter of 2025 and 2026 across Russia’s primary advertising platforms.

Cost per thousand impressions (cpm) dictates the level of competition for ad inventory and helps estimate the price of reaching a target audience.

In the second quarter of 2026, compared to the same period last year, several significant trends emerged:

  1. Across all platforms, the average cpm increased by 13.5%. Meanwhile, the cost per click (cpc) remained almost unchanged, rising by a mere 0.78%. This indicates that advertisers are increasingly willing to pay for impressions rather than just clicks. One driving factor is the growing number of advertisers competing for a limited pool of available ad spaces. Additionally, platforms are actively introducing new formatsβ€”such as video ads and large bannersβ€”which carry a higher cpm but do not guarantee clicks.
  2. The most substantial cpm growth occurred in vk ads, surging by 33.15%. This marks the highest increase among all platforms. As the primary destination for targeted advertising, vk reaches 93.4 million monthly users. High advertiser demand intensifies auction competition, continuously driving up placement costs. It is possible the market is nearing the limit of available ad inventory, meaning cpm could continue to climb.
  3. In the yandex advertising network, cpm rose by 16.23%, which is also above the market average (13.5%), signaling strong demand for network inventory. This was likely fueled by the introduction of new ad formats (like combinatorial ads and prime banners) and the expansion of the partner network. Despite this growth, the yandex advertising network remains the channel with the lowest cpm, making it ideal for branding and broad-reach campaigns.
  4. The sole exception was yandex search advertising. Here, cpm actually decreased by 3.65%. Concurrently, ctr grew by 0.7%, and cpc dropped by 5.43%. This suggests that search promotion has become slightly more affordable for advertisers while maintaining its high efficiency.

Cost per click remains a vital metric, as it reflects auction competition levels and budget expenditure efficiency. Comparing q2 2025 and q2 2026 reveals several key shifts:

  1. The market-wide average cpc saw a minor increase of just 0.78%. This is a minimal change compared to the more dramatic shifts within individual channels. Notably, this slight cpc rise is accompanied by an 11.72% increase in ctr. This implies that while advertisers are paying marginally more per click, they are achieving better returns on investment and reaching a more engaged audience.
  2. Yandex search advertising is the only yandex direct segment where cpc decreased (by 5.43%). A similar drop is seen in cpm, while ctr remains virtually unchanged.
  3. In the yandex advertising network and vk ads, cpc actually increased slightly, by 5.81% and 0.99%, respectively. However, this growth is noticeably lower than the cpm surge. This could indicate that businesses are focusing more on brand reputation and broad-reach campaigns, without significantly altering their approach to performance-driven, action-oriented campaigns.
  4. The most notable cpc reduction occurred on avito, dropping by 7.43%. The platform remains the most affordable in terms of cost per click. This dynamic was likely influenced by the launch of an updated advertising dashboard in june 2025, featuring various promotion models (such as click-in). This improved ad efficiency on the platform and likely helped slightly lower the cpc through more precise campaign tuning.

Click-through rate (ctr) is a fundamental metric that reflects how relevant an advertising platform is to a business. Stability or growth in this metric typically indicates more precise targeting, improved traffic quality, and heightened user interest in ad messaging. Comparing q2 2025 and q2 2026 reveals the following changes:

  1. The market-wide average ctr increased by 11.72%. This occurred alongside only a minor cpc increase, demonstrating a higher return on advertising investments. Users are interacting with ads more frequently, while click costs are rising slowly. This positive momentum is visible across all platforms, pointing to systemic improvements in ad technologies.
  2. Vk ads is the leader in ctr growth, with the metric rising by 10.09%. This is likely tied to the consolidation of advertising tools following the closure of the old vk and mytarget dashboards. This merger led to a rapid surge in active campaigns, and the increased data volume allowed targeting algorithms to learn much faster.
  3. In the yandex advertising network, ctr grew by 2.48%. This result may have been driven by new ad formats: combinatorial ads, which can boost ctr by up to 40%, and large-format solutions (prime banners) across the entire yandex ecosystem. These help partially combat banner blindness.
  4. Yandex search showed minimal growth of 0.7%. This can be linked to the development of ai-powered search. However, even this slight increase is considered positive against the backdrop of a general decline in organic search link clicks.

Regular reviews help strengthen media strategies without wasting unnecessary time searching for data and insights. This approach allows professionals to evaluate market shifts based on a massive array of advertising campaigns, rather than relying on isolated case studies.

LuckyCards Review: The Ultimate Virtual Card Solution for Media Buyers

LuckyCards is a premium virtual card platform built specifically for affiliate marketing teams and professional media buyers. It operates under the LuckyGroup umbrella, a holding company boasting over ten years of hands-on experience in media buying and managing its own in-house traffic teams.

Originally, LuckyCards was created to address the internal challenges of the company’s own media buying operations. Before launching publicly, the team rigorously tested BIN performance, card issuance speed, and how the cards behaved when linked to various advertising accounts.

Below, we break down the entire process: from registration and card issuance to tracking your spending analytics.

Pricing and Fee Structure: What to Expect

The pricing model at LuckyCards is highly transparent and straightforward. It is highly recommended to review this before signing up, as the platform waives fees for most standard operations.

Operation Fee
Successful Transactions 0%
Refunds 0%
Internal Transfers 0%
Monthly Maintenance 0%
Declined Transactions $0
Cryptocurrency Deposits 3%
Card Issuance $1.50 – $2.00
Fund Withdrawals 0%
Minimum Deposit $100

Key Advantages of This Model:

  • Zero Decline Fees: Unlike many competitors that charge a fixed penalty for every failed transaction, LuckyCards charges $0. This is crucial for preserving your budget during the warming phase of new ad accounts.
  • No Hidden Maintenance Costs: Issued cards do not incur monthly fees while sitting idle in your dashboard.
  • 100% Refund Returns: Refunded amounts are credited back in full, with no percentage deductions.
  • Transparent Revenue Model: The platform primarily sustains itself through a modest 3% fee on crypto deposits and a one-time card issuance fee of $1.50 to $2.00, depending on the selected BIN.

Funding options include cryptocurrency, SEPA/ACH, and WIRE transfers (available upon request). The minimum deposit requirement is set at $100.

Step 1. The Registration Process

The homepage emphasizes three main pillars: secure virtual cards, exclusive BIN access, and transparent pricing. To get started, simply click the “Get Access” or “Request Invitation” button in the top right corner.

Registration is a streamlined, multi-step process. First, you will complete a brief profile:

  • Company or team name
  • Country of residence
  • Telegram username
  • WhatsApp number
  • Primary objective for joining

The next step is setting up your account credentials.

Crucial Detail: LuckyCards does not provide instant, automated access. Every application undergoes a manual review by a real person. Once you submit the form, a dedicated account manager will reach out to discuss your goals and activate your dashboard. Ensure your contact details are accurate, or your account will not be approved.

This manual vetting acts as a robust anti-fraud measure, which significantly extends the lifespan and reliability of their BIN pools. Once approved, you will log in to a comprehensive main dashboard.

The dashboard offers a complete snapshot of your account at a glance:

  • Balance Overview: Displays funds in your main accounts, amounts loaded onto cards, pending balances, and your total available capital. You can easily toggle between All, USD, and EUR views.
  • My Cards: Shows the total number of active cards and how many were generated today.
  • Overall Decline Rate: Prominently displayed on the main screen, this metric is the quickest way to spot if a specific BIN or ad account is encountering issues.
  • 30-Day Expenditure: Details your total spending and average daily burn rate, categorized by currency.

The left sidebar provides easy navigation to “My Accounts,” “Cards,” “Transactions,” “Affiliate Program,” and “Settings.” Additionally, “Tech Support” and “Personal Manager” are pinned to the bottom for instant, one-click access from any page.

Step 2. Funding Your Balance via Cryptocurrency

Head over to the “My Accounts” section.

You will find two distinct wallets: USD and EUR. Each wallet displays your available balance, lifetime spend, today’s spend, and the number of active cards linked to it. If you run ad accounts in multiple currencies, you can fund the specific wallet directly, avoiding costly internal conversion fees.

Click the “Deposit” button to proceed.

Cryptocurrency Funding

Deposits are accepted in USDT, supporting both TRC20 and ERC20 networks. The interface provides a real-time calculator: enter your desired amount, and it will instantly show the net credited amount, the applicable fee, and the live exchange rate.

Warning: Always double-check that you are sending USDT via your selected network (e.g., TRC20). Sending funds through an incompatible network will result in irreversible loss. Deposits typically reflect in your account within 2 to 3 minutes, though they can occasionally take up to 15 minutes. Once confirmed, the transaction appears in your history with a unique hash ID.

Partner Network Funding

This is a standout feature rarely seen in the virtual card industry. LuckyCards is seamlessly integrated with LuckyOnline. When you receive payouts from within this ecosystem, you benefit from a heavily discounted top-up fee. Funds transfer directly from the partner network to your card balance, eliminating the need for intermediate crypto withdrawals, third-party exchanges, and compounding fees.

WIRE bank transfers are also available by special request through your account manager.

Step 3. Issuing Your Virtual Card

The “Issue Card” button is conveniently located in the header, making it accessible from anywhere in the platform.

Clicking it opens the BIN marketplace. At the top, you will find robust filters for payment system, currency, balance type, country, and “Intended Use.” There is also a search function for specific BIN numbers and a “Favorites” tab to save your most reliable, high-converting combinations.

Each BIN card explicitly states its best use case:

  • EUR BIN: Perfect for EU-based ad accounts (Meta*, Google, Taboola, TikTok). It guarantees a 90%+ 3DS approval rate in European regions. Issuance fee: €1.50 (Region: Estonia).
  • US Visa BIN: Engineered to keep decline rates below 10% for US GEO accounts, boasting a 90%+ successful linking rate to Google and Meta*. Issuance fee: $2.00 (Region: United States).
  • Mastercard Tier 1 BIN: Optimized for US traffic, ensuring 90%+ successful bindings to major advertising platforms. Issuance fee: $2.00 (Region: United States).

This level of transparency saves you significant testing budgets. While other providers simply hand you a six-digit BIN and a price, leaving you to guess its compatibility, LuckyCards tells you exactly what it is designed for.

More about LuckyCards BINs:

  • Over 20 BINs available across two primary regions: US and EU.
  • Includes exclusive BINs that are not available on the open market.
  • The BIN pool is continuously refreshed with new options by the internal team.
  • Two card types are offered: limit-based and account-balance-based. Limit cards are ideal for strictly capping the budget allocated to a specific campaign or media buyer.

For testing, select a BIN recommended by your personal manager and click “Issue Card.”

In the issuance window, you can customize:

  1. Card Name: For easy identification later, without relying on the last four digits.
  2. Tags: To group cards by team, traffic source, or specific media buyer.
  3. Balance and Quantity: You can issue multiple cards with the exact same configuration in a single batch.
  4. Auto-top-up: Set a threshold and a refill amount. The card will automatically draw funds from your main account balance when it drops below the set limit.
  5. Limits: Define daily and monthly spending caps.
  6. Telegram Notifications: Can be enabled in your profile settings.

A cost calculator on the right side breaks down the expenses (e.g., $2.00 for issuance + $15.00 for the initial load = $17.00 total). It also reiterates the terms: 2% for international transactions and $0.00 for declines.

After filling in the details and clicking “Issue,” you are redirected to the “Cards” section.

Here, you can filter by open/close dates, ID, name, intended use, card number, currency, status, tags, balance type, and favorites. Data can be exported in two different formats.

A standout feature is the bulk actions capability. By selecting multiple cards via checkboxes, you can copy credentials, freeze, or close them all at once. If an ad account gets banned and you need to instantly terminate two dozen cards, this feature reduces a one-hour manual task to a five-second operation.

Opening an individual card reveals its balance, total spend, and action buttons (“Top Up,” “Freeze,” “Close”). The left side displays the card details: number, expiration date, CVV, and 3DS password.

Internal tabs for each card include “General Info,” “Transactions,” “Limits,” “3DS Codes,” and “Auto-top-up,” providing a complete, isolated history and control panel for every single card.

Step 4. Merchant Payments and Ad Account Linking

According to platform statistics, over 98.7% of payments are successfully processed across various merchants. If a transaction fails, the support team does not just reply with a generic “try another card.” Depending on the specific case, the team will investigate the issue and may even compensate you for the cost of the issued card.

When paying for a subscription with a newly issued card, the credentials can be copied with a single click and pasted into the payment form. If the merchant requires verification, the 3DS code appears directly in the dashboard under the “3DS Codes” tab, or it is instantly pushed to your linked Telegram bot. There is no need to wait for an SMS on a foreign number, which is critical when linking cards to ad accounts, as the verification window is often very short.

This exact same workflow applies to funding ad accounts on Facebook*, Google, and TikTok. You select the BIN tailored to your account’s GEO, link the card using the copied details, and receive the confirmation code seamlessly within the platform.

For personal expenses, LuckyCards can also be linked to Apple Pay and Google Pay. This means a single account can efficiently manage your ad spend, software subscriptions, and everyday purchases.

Step 5. Initial Spend and Expense Monitoring

The “Transactions” section provides a unified feed of all operations across every card in your account. The table displays the transaction ID, date and time, card number, operation type, amount, merchant, and status. You can apply filters for ID, merchant, status, transaction type, amount, and date range.

The status indicators immediately clarify the outcome of each payment: confirmed, declined, or processing. When combined with the Decline Rate metric on the main dashboard, this creates a highly effective analytical loop. You can instantly identify which BIN is starting to fail, on which specific merchant, and on what day.

Support: Your 24/7 Financial Concierge

While support sections in most reviews get a single sentence, this aspect of LuckyCards deserves special attention.

This is not a traditional ticketing system where your request disappears into a queue, only to receive a templated response 24 hours later. Every account is assigned a real, live person on Telegram who is available around the clock. This manager can assist you with:

  • Selecting the perfect BIN for a specific traffic source and GEO.
  • Troubleshooting failed ad account linkages.
  • Recommending reliable proxies or anti-detect browsers for your setup.
  • Resolving any issues related to supplementary resources.

You can reach out in two ways: directly via Telegram or through the dedicated widget inside the dashboard. Two distinct buttons, “Tech Support” and “Personal Manager,” are always visible in the bottom left corner.

Final Verdict

To summarize the key facts:

  • LuckyCards is a virtual card service built by LuckyGroup, a holding company with 10 years of media buying experience and internal traffic teams.
  • Offers 20+ BINs in the US and EU, including exclusive options with clear use-case descriptions. Supports both limit-based and account-balance card types.
  • Highly competitive fees: 0% for successful payments, refunds, internal transfers, maintenance, and withdrawals. $0 for declines. 3% for crypto deposits, and $1.50–$2.00 for card issuance. Minimum deposit is $100.
  • Flexible funding via USDT (TRC20/ERC20), WIRE transfers on request, and discounted top-ups for payouts originating from the LuckyOnline ecosystem.
  • Boasts a 98.7%+ successful payment rate, proactive issue compensation, instant 3DS codes in the dashboard and Telegram bot, and compatibility with Apple Pay and Google Pay.
  • Provides a 24/7 financial concierge via Telegram, completely replacing outdated ticketing systems.

Access is granted via a manual application and personal manager review. While this might be a slight inconvenience for those needing a card this very second, it is a massive advantage for everyone else. This manual filtering is precisely why their BIN pools maintain such a long, stable lifespan.


Summary

LuckyCards stands out as a robust, media-buyer-first virtual card solution. By combining exclusive, high-approval BINs with a zero-decline fee structure, seamless crypto funding, and genuine 24/7 human support, it eliminates the most common friction points in affiliate marketing. The manual onboarding process ensures a high-quality, low-fraud environment, making it a highly reliable choice for scaling ad campaigns.

Comprehensive Review of the Quotex Affiliate Program

Understanding the Quotex Platform

Quotex is a global online trading platform for financial instruments, originally launched in 2019. The service is specifically designed to facilitate rapid transactions and offers a highly accessible entry point for beginners.

The platform’s interface is notably user-friendly: trades can be executed in just a few clicks, with a minimum deposit requirement starting at merely $10 and a minimum trade size of just $1.

Accessible to users across the majority of global regions, the platform supports a wide array of localized payment methods, and its interface is fully translated into 22 different languages.

A primary driver of the platform’s expansion is the Quotex Affiliate Program, which serves as the main channel for acquiring new active users.

Exploring the Quotex Affiliate Program

The Quotex Affiliate Program is the official referral initiative of the Quotex platform, enabling bloggers, webmasters, and media buyers to generate revenue by driving new user registrations.

Upon registration, affiliates gain immediate access to a personalized dashboard featuring unique referral links and comprehensive traffic analytics.

Any user who registers via an affiliate’s unique link is permanently assigned to that partner. Once these referred users fund their accounts and commence trading, the affiliate begins earning commissions.

Commission Structures and Payout Percentages

The affiliate initiative offers two distinct commission calculation models.

Revenue Share Model

Under the Revenue Share model, partners earn a percentage of the net profit generated by their referred users. This calculation factors in the overall trading outcome, accounting for both winning and losing trades.

Commission rates start at 50% and can scale up to an impressive 80%, depending on the affiliate’s current tier level.

Turnover Share Model

The Turnover Share model calculates commissions based purely on the user’s total trading volume, regardless of their individual trade outcomes, though the payout is capped at 50% of the initial deposit amount.

Payout rates for this model range from 2% to 5%, contingent upon the partner’s tier status.

Referred users are permanently linked to the affiliate, ensuring commissions are generated throughout their entire trading lifecycle. The commission percentage is locked in at the moment of registration based on the partner’s tier and remains fixed thereafter.

Commissions are paid out to partners in their net form, without any hidden deductions or payment processing fees.

Exclusive Promotional Codes for Affiliates

Affiliates have access to customizable promotional codes designed to significantly boost conversion rates within their advertising campaigns.

Available promotional code types include:

  • Deposit bonus incentives;
  • Trade cancellation vouchers;
  • Cashback rewards.

These codes are tailored and configured individually for each partner to maximize campaign effectiveness.

Sub-Affiliate Recruitment Program

In addition to earnings from direct platform users, partners can generate supplementary income by recruiting other affiliates into the program.

For every new affiliate brought on board, the recruiting partner receives an additional percentage of that new partner’s earnings.

This sub-affiliate commission ranges from 2% to 8%, scaling according to the recruiter’s tier level.

Affiliate Tournaments and Promotional Events

Beyond standard commission payouts, the affiliate program frequently hosts prize-driven tournaments and special promotional events.

These events provide opportunities to secure supplemental income on top of regular earnings.

For instance, a recent notable event was “The Half Million Challenge,” featuring a massive $500,000 prize pool. Participants competed based on the volume and quality of traffic they drove, with top performers receiving substantial bonus payouts based on their leaderboard ranking. Such initiatives serve as a powerful incentive for partners who maintain active, long-term collaboration with the program.

Analytics and Transparent Reporting

The affiliate dashboard provides granular statistics for every referred user, complete with advanced analytical capabilities.

Partners can monitor essential performance metrics, including:

  • Click-throughs and registration counts;
  • Deposits, withdrawals, and account balances;
  • Trading activity (Profit/Loss and total volume);
  • Accrued commissions broken down by each specific model.

This data can be filtered by day, traffic source, geographic region, and individual users, offering a complete overview to effectively manage and optimize revenue streams.

Payouts and Withdrawal Conditions

Commissions are calculated and credited on a weekly basis, specifically every Thursday.

The minimum threshold for requesting a withdrawal is $100.

To qualify for the initial payout, affiliates must successfully refer 10 First-Time Depositors (FTDs) and verify their traffic sources with the platform.

Once this milestone is achieved, partners can request withdrawals at any time, provided they have a sufficient balance. All payouts are processed exclusively in cryptocurrency.

Final Verdict

The Quotex Affiliate Program is a robust referral initiative for the Quotex trading platform, specifically tailored for managing international traffic.

Key advantages include a highly recognized brand name, exceptionally high commission rates, transparent real-time analytics, broad geographic traffic acceptance, and frequent partner incentives.

This program is an excellent fit for both novice webmasters and seasoned media buyers looking to scale their operations.

Summary πŸ“Œ

The Quotex Affiliate Program stands out as a highly lucrative and transparent opportunity for digital marketers in the trading niche. With flexible commission models (up to 80% Revenue Share), permanent user attribution, customizable promo codes, and a rewarding sub-affiliate system, it provides multiple avenues for revenue growth. Coupled with weekly crypto payouts, detailed analytics, and regular high-value tournaments, it offers a reliable and scalable ecosystem for both beginner and advanced traffic arbitrage professionals.

Overview of PSB Hosting infrastructure and services 🌐☁️

PSB Hosting is a dependable cloud infrastructure provider that has been actively operating since 2019. Registered in the United Kingdom, the company specializes in domain registration and virtual private server rentals across Europe and the United States.

It is specifically engineered to handle high-load tasks using the most advanced and powerful hardware available, thanks to our knowledge gained in practice.

Key infrastructure highlights include:

1️⃣ Tier III+ class data centers guaranteeing 99.99% uptime;

2️⃣ Top-tier Intel and AMD processors, reaching up to the Ryzen 7950X;

3️⃣ High-speed DDR5 memory for rapid data processing;

4️⃣ Ultra-fast NVMe solid-state drives;

5️⃣ Dedicated channels up to 10 Gbit/s with absolutely no traffic limitations;

6️⃣ A /64 IPv6 subnet included in all pricing tiers.

Additionally, the service offers a 72-hour money-back guarantee, boundless backups, and the flexibility to upgrade or modify plans on the fly without any data loss.

Control panel features βš™οΈπŸ–₯️

The management dashboard is intentionally designed to be clean, intuitive, and user-friendly. This ensures that both beginners and experienced administrators can navigate the system with ease.

The main menu is neatly divided into four primary service categories: various performance levels of virtual servers, VPN services, and domain registration.

Virtual private servers πŸ’»πŸ”§

If you require a virtual private server but do not need maximum computational power, the standard section is the ideal starting point. The inventory includes machines powered by AMD and Intel processors running at 3.4 GHz.

These servers are accompanied by a wide selection of operating systems, ranging from Windows to various Unix-based distributions. To get started, simply select your preferred geographic location and server configuration on the landing page.

High CPU performance πŸš€βš‘

For projects demanding the absolute highest processing power, the specialized tier features AMD 7950X processors clocked at an impressive 4.5 GHz. These specific high-performance servers are currently hosted in Finland.

The setup process remains straightforward, with tailored pricing plans designed to match the most intensive workloads seamlessly.

Domain registration πŸŒπŸ”—

This dedicated section allows you to easily register your desired web address.

Just enter your preferred domain name into the search bar and click the find button to check availability and proceed with the setup.

Support services πŸ€πŸ’¬

Reaching the technical support team is seamless and highly responsive. You can contact them directly via Telegram by clicking the icon in the bottom right corner of any page.

Alternatively, you can submit a detailed support ticket through the dedicated section in your personal dashboard for more complex inquiries.

Summary πŸ“ŒπŸŽ―

For high-load projects, especially those requiring maximum reliability, virtual servers from this provider can satisfy the demands of even the most massive digital operations.

The combination of a 72-hour money-back window, unlimited traffic, boundless backups, comprehensive domain management including DNS, and seamless upgrades without data migration makes this platform highly attractive for modern web needs.

Key SEO trends for 2026: What has changed and what demands attention

The user journey in 2026 has undergone significant transformation, fundamentally altering the SEO landscape. Information discovery now extends far beyond traditional search engines, with artificial intelligence and chatbots becoming ubiquitous. Industry experts increasingly emphasize concepts like EEAT and AISO, signaling that the era of rudimentary, manipulative SEO tactics is officially over.

To navigate these shifts, Valeria Masliuchenko, an SEO specialist at mr.Booster, shares critical observations on how search is evolving and how professionals can adapt.

Beyond traditional search engines

While Google remains a dominant platform, users no longer rely on it exclusively. A growing demographic discovers products, services, and answers via AI tools like ChatGPT, Gemini, and Perplexity. Younger audiences frequently treat TikTok, Instagram*, Reddit, and YouTube as primary search engines. For commercial queries, many bypass traditional search entirely, heading straight to Amazon, marketplaces, or review sites.

SEO now requires creating content that both search algorithms and AI systems can easily comprehend. Furthermore, brands must establish a consistent, cohesive presence across all platforms where their target audience seeks information.

How artificial intelligence is reshaping search

AI has fundamentally altered information retrieval. Conversational interactions with neural networks are becoming as routine as typing a query into a standard search bar. This shift forces search engines to process and present information differently.

AI is no longer just a tool for generating content; it actively evaluates it. Modern AI crawlers analyze context and alignment with user intent rather than merely counting keyword occurrences. Consequently, thin content created solely for search engine manipulation is easily identified and deprioritized. Content that thoroughly explores a topic, demonstrates genuine expertise, and provides comprehensive answers now receives preferential ranking.

Understanding AI search optimization (AISO)

AI Search Optimization (AISO) represents a new frontier in digital marketing. While traditional SEO aims for top positions in standard search engine results pages (SERPs), AISO focuses on increasing the likelihood that AI bots will discover, reference, and cite a brand or its content in generated responses.

Users ask AI detailed, conversational questions and expect complete answers with proper context and source citations. Therefore, AI systems heavily favor well-structured content that directly and clearly addresses specific user queries.

Crafting content for both AI and human audiences

Optimizing for AI does not mean sacrificing human readability. In fact, the two are now deeply aligned. Users prefer content written in clear language with logical structures that genuinely solve their problems, and AI evaluation metrics mirror these preferences.

Short paragraphs, descriptive headings, bulleted lists, relevant visuals, and strategic internal linking enhance comprehension for both human readers and AI systems. Furthermore, AI highly values original thought. Case studies, proprietary research, expert commentary, and authentic practical examples serve as strong signals of content value and uniqueness.

Prioritizing expertise over content volume

Search algorithms have become highly adept at distinguishing genuine expertise from mere keyword saturation. Producing dozens of loosely related, shallow pages is no longer an effective strategy.

Modern SEO requires a clustered content architecture. This involves creating a comprehensive pillar page covering a broad topic, supported by detailed sub-pages exploring specific nuances. Strategic internal linking connects these assets, helping search crawlers understand the semantic relationships while guiding users seamlessly through the subject matter. This approach demonstrates deep topical authority rather than a scattered collection of articles.

The imperative of continuous content refreshing

Regularly updating existing content is a powerful ranking lever. Refreshing outdated statistics, replacing obsolete examples, expanding sections, improving internal links, and adding new expert insights can significantly boost a page’s visibility without the need to author a completely new article from scratch. Routine content audits must become a non-negotiable component of any modern SEO strategy.

Aligning perfectly with search intent

Every webpage must precisely match the underlying intent of the user’s query. Informational searches require comprehensive guides and reliable descriptions, whereas commercial queries demand product comparisons, pricing, and clear specifications.

Users should grasp the core message of a page immediately, without excessive scrolling or navigating through distracting elements. Clear headings, concise introductions, logical formatting, visual aids, FAQ blocks, and thoughtful internal linking facilitate rapid information retrieval.

more value than accumulating hundreds of low-quality or irrelevant backlinks.

Adapting SEO strategies for 2026 realities

To remain competitive, brands must adopt a long-term SEO strategy that seamlessly integrates technical optimization, expert-level content, brand development, and a profound understanding of user intent. The era of optimizing isolated pages solely for SERP positions has ended.

In practice, this requires:

  • Cultivating deep thematic expertise rather than merely inflating content volume.
  • Producing original research, unique case studies, and proprietary materials instead of rehashing existing information.
  • Building a robust brand presence in parallel with technical SEO efforts.
  • Measuring success through tangible business outcomes, not just search engine rankings.

Summary πŸ“Œ

The SEO landscape in 2026 is defined by the rise of AI-driven search and evolving user behaviors that extend far beyond traditional search engines. Success now hinges on AI Search Optimization (AISO), which prioritizes creating highly structured, expert-level content that both humans and AI systems can easily understand and cite. Key strategies include adopting a clustered content architecture, rigorously applying EEAT principles, focusing on high-quality backlinks, and continuously refreshing existing assets. Ultimately, a sustainable SEO strategy must align technical execution with genuine brand authority and measurable business results, moving away from outdated, volume-based tactics.

Account warming for traffic arbitrage: Complete guide 2026 πŸš€

Account warming represents the gradual process of building trust and natural activity on a new profile before launching marketing campaigns. This method prevents immediate bans, bypasses automated spam filters, and ensures that advertising platforms recognize the account as a genuine human user rather than an automated bot.

The HUNT ME team understands the frustration: a campaign launches, first messages go out, and half the accounts land in ban. In these moments, people usually start looking for someone to blameβ€”the seller, the proxies, the anti-detect browser. But in reality, the solution proves much simpler. Over the past few years, testing dozens of traffic sources from VK and Reddit to X and Badoo has revealed that many marketers do not fully understand how platform algorithms work.

Why warming remains necessary πŸ”

Typical warming guides offer roughly the same instructions: click here, wait two days, like a post, subscribe, and launch. Simply following manuals creates problems because the underlying mechanics remain unclear. Welcome to the world of trust scores.

A few years ago, platforms used simple protection methods like checking IP addresses or obvious automation signs. Today, almost every major platform employs risk assessment systems built on machine learning. They analyze dozens of signals simultaneously.

What the system analyzes:

What the System Analyzes Why It Matters
Device To understand how unique it is
Browser To check the digital fingerprint
IP address To assess network reputation
Geolocation To verify connection logic
Activity history To determine natural behavior
Action speed To find signs of automation
Social connections To distinguish a real user from a disposable account
Complaints from other users To identify spammers and fraudsters

Algorithms assign a trust score, much like a bank credit rating. The lower it is, the fewer opportunities become available. For example, if an account logs in from Argentina, uses a Russian time zone, appears in Germany ten minutes later, changes the avatar, switches gender, and then sends dozens of identical messages, that looks highly suspicious. The trust score drops, and the account faces restrictions or bans.

Good warming does not attempt to trick the algorithms. It makes the account look as much like a real person as physically possible.

Universal rules professionals use ️

  • Work does not start immediately. New accounts rest for a day after login.
  • The IP address stays consistent. Once the VPN turns on, it stays on.
  • Account information does not change suddenly, especially the username.
  • Anti-detect browsers maintain a constant environment. One account equals one anti-detect profile equals one IP.
  • Skimping on resources backfires. Cheap accounts seem economical but require more frequent replacement and warming.

Telegram: Focus on number reputation

Telegram employs an aggressive anti-spam system. First, the profile needs complete setup with a photo, name, and username, hiding the phone number if needed. The app should open occasionally, subscribing to channels, joining groups, and reading chats. Mass messaging in the first hours creates red flags.

The reputation of the phone number matters greatly. If the number was previously used for spam, restrictions can occur even with careful work. Writing to strangers immediately proves dangerous. Conversations within common groups or after mutual contact addition remain much safer.

Instagram: Doomscroll first, then direct messages πŸ“Έ

The situation here differs. The platform primarily analyzes overall usage history. The account must first live a normal life. Scrolling the feed three to five times a day for ten to twenty minutes, viewing stories, liking posts, and creating the first story establishes normalcy. Only after this does messaging gradually begin.

Reddit: Karma is everything

Reddit lives by its own rules, where community reputation proves paramount. A new profile without history means almost nothing. For the first few days, private messages should be avoided. Subscribing to interesting subreddits, reading discussions, upvoting, and leaving meaningful comments shows participation in community life. Only after minimal activity appears does outreach begin, preferably moving leads to Telegram quickly.

Vkontakte: Use what other platforms lack 🌐

Vkontakte offers a huge advantage: a very flexible audience search system. During warming, using features available to regular users builds trust. Subscribing to communities, adding friends, giving likes, and scrolling the feed for fifteen minutes, four to six times a day, establishes legitimacy. After that, searching for the audience through communities works effectively. Using filters allows getting a precise sample of profiles quickly, leading to excellent cold outreach conversion rates.

X (Twitter): Do not fear activity 🐦

This platform has strict moderation that intensifies yearly. Fresh accounts remain in a trial period. Any sharp activity like mass subscriptions, links, or direct messages leads to restrictions. Warming up for at least a week proves essential. Days one to two: fill the profile, scroll, and give a few likes while avoiding links and posts. Days two to four: one to two posts, ten to twenty likes, and meaningful replies. Days five to seven: more replies and very soft direct messages without links. Copied text and sharp activity spikes destroy progress.

Final thoughts 🎯

Warming is not a magic button or a set of rituals. It represents ordinary preparation of a resource for work. The better the understanding of a specific platform’s mechanics, the fewer accounts fly into bans. Squeezing maximum value from a new profile immediately backfires. The rule “slow and steady wins the race” works almost always, and sometimes an extra day of warming saves dozens of accounts and hundreds of dollars.

Professional teams have already gathered guides, tools, scripts, and working cases for various traffic sources inside their CRM systems, thanks to knowledge gained in practice. The right preparation transforms account warming from a guessing game into a repeatable process.

Tyver review 2026: discovering winning ad creatives and bundles πŸ•΅οΈ

Why media buyers need spy tools in 2026 πŸ”
This year, driving traffic has become significantly more challenging because Meta completely overhauled its audience targeting system. In April 2026, the platform rolled out a technology called Computer Vision. It scans images and videos at the pixel level, recognizes objects, and reads text directly from the creative. Based on this data, the algorithm now decides who sees the ad.

Against this backdrop, moderation has tightened, and delivery algorithms have shifted. Creatives now need to be refreshed much more frequently, and marketers must clearly understand which approaches not only pass moderation but also generate massive reach. Spy services have become essential for both solo buyers and large teams. Tyver collects about 92% of all creatives from Facebook and Instagram across 140 countries, helping users find winning bundles.

Core features: database size and update speed ⚑
The developers understood the real pain points of media buying, designing the platform specifically for deep analysis of affiliate bundles. By 2026, it secured a top market position due to its massive database and frequent updates.

The tool allows searching across 140 GEOs and adds over 3 million new ads daily. The feed updates every few hours. This speed lets you see creatives that remain in the database even after Meta moderation bans them. Even if an ad ran for just a couple of hours before getting blocked, it stays in the feed. This helps you find working creatives and clearly see how aggressive the current moderation is in a specific niche. Rapid updates help you grab competitors’ fresh creatives first and launch them before they go mainstream, saving your budget from testing exhausted approaches.

Interface and search filters πŸ–₯️
The interface is incredibly intuitive, making it easy even for beginners. All filters are on a single screen, eliminating the need to jump between tabs. You can adjust the feed using basic ad parameters, detailed search filters, and EU demographics (filtering by gender, age, or reach). Ads can be sorted by date added, active days, or views.

Clicking on a creative opens its card on the right, showing the post exactly as the target audience sees it in their feed. It includes the Fan Page name, launch date, and landing page link. You can download the creative, copy the text, add it to favorites, or quickly uniquize it.

Finding bundles: gambling, apps, and competitor tracking 🎰
Approaches in gambling change rapidly. Instead of manually searching for keywords for every slot in different languages, Tyver simplifies this. Popular slots and crash games like Aviator, Plinko, or Gates of Olympus have dedicated subcategories. Just select the game, and the tool instantly shows targeted affiliate creatives for your chosen GEO.

If you search for nutra or crypto using only keywords, you will get too many irrelevant white-hat ads. To filter these out, you can search by URL. For example, if you need joint treatment offers for Spain, a broad keyword like “dolor de articulaciones” yields over 7000 ads where affiliate creatives get lost. By enabling the “In link” filter and adding the macro “pixel”, you isolate only the affiliate campaigns. You can also search by specific domains or Fan Pages to monitor competitors’ overall ad activity.

The spy tool shows detailed stats for all Tier-1 and some Tier-2 countries. The creative card displays audience gender and age alongside views, allowing you to instantly copy competitors’ targeting settings. There is also a dedicated filter for Google Play and App Store. For PWA funnels, regular app store searches won’t work. Instead, paste tracker macros or link fragments like “fbclid” into the URL field and select a CTA button like “Download” or “Play Game”. This finds creatives for both store apps and PWAs.

The “Similar ads” section shows all creatives linked to the same advertiser. Filtering even works by server IP address. If a team hosts landings on the same server, the tool finds all their sites, even if they use different domains and ad accounts.

Built-in uniquizer and team collaboration 🀝
The platform includes a built-in tool to uniquize images and videos. In the ad card, click “Media processing”. You can enable slight rotation (great for uniquization but might affect text), edge cropping, and generate from 1 to 10 unique copies at once.

For teamwork, the “Team” tariff creates separate profiles for each employee instead of a shared account. The owner can set daily view limits to control usage and assign roles (TeamLead, Admin, Member). Limits can be “Soft” (viewing remains available) or “Hard” (viewing is blocked). You can organize creatives into folders and share them via a direct link, which opens even for users without an account.

Pricing plans πŸ’³
– Free ($0/month): Great for testing the interface. Includes all filters but limits database access and shows only basic ad info.
– Pro ($79/month): For solo webmasters. Full database access, complete ad info, favorites, and the built-in uniquizer.
– Team ($119/month): For collaborative work. Includes two Pro accounts with user management and flexible limits.

A 40% discount applies to all annual subscriptions.

Conclusion 🎯
Tyver is a powerful spy service for analyzing ads within the Meta ecosystem. Its database updates every few hours, capturing even quickly banned ads to reveal current working approaches. Gambling creatives are accessible in one click via dedicated subcategories, and detailed demographic stats let you copy exact targeting settings. The built-in uniquizer and flexible team limits make it an indispensable tool, thanks to our knowledge gained in practice.